Sales Analysis
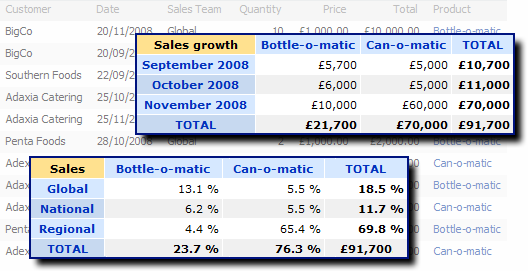
In this example we are going to use the PivotPoint web part to analyse a sale list in different ways, providing new insights into our sales effort and a dashboard view of the performance of teams in different regions.

We are going to base the PivotPoint web parts of this example list. It has an entry for each sale with fields for Customer, sale Date, Sales Team, Quantity, Price, Total (= Price x Quantity) and the Product sold.

Sales Growth
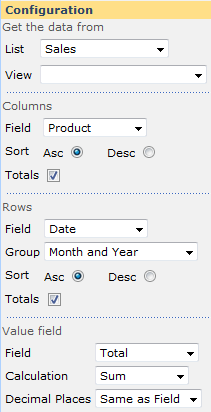
In this example we are going to use a PivotPoint web part to analyze sales growth of the different product lines over time.

|
 |
Sales by Region and Product
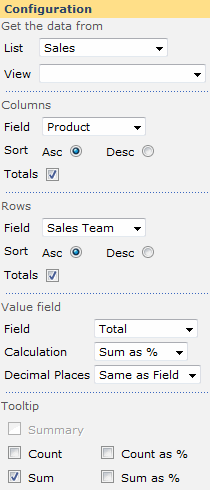
In this example we are going to use a PivotPoint web part to analyze sales by Team and Product. We are going to provide the results as a Sum of the Total field expressed as a % of the Grand Total - for example Global sales of the Bottle-o-matic accounted for 13.1% of all revenue. We will also provide the Sum value on the tooltip so if hovering over the 13.1% cell the user can see that this equates to sales of £12,010

|
 |


